Review of sustainability
General
We experienced an increased focus on environmental, social and governance (ESG) criteria from rating agencies and our investors, as these criteria are a popular way for the financial market to evaluate companies beyond financial and risk indicators. We were able to answer their queries adequately with our existing sustainability data and report.
Value creation model
In 2021, we let go of the Q-Park Liveability Model in favour of a more recognisable value creation model. By choosing a single model to give insights into our efforts, choices and impacts we aim to create an overview which is comprehensive yet easy to understand.
Materiality analysis
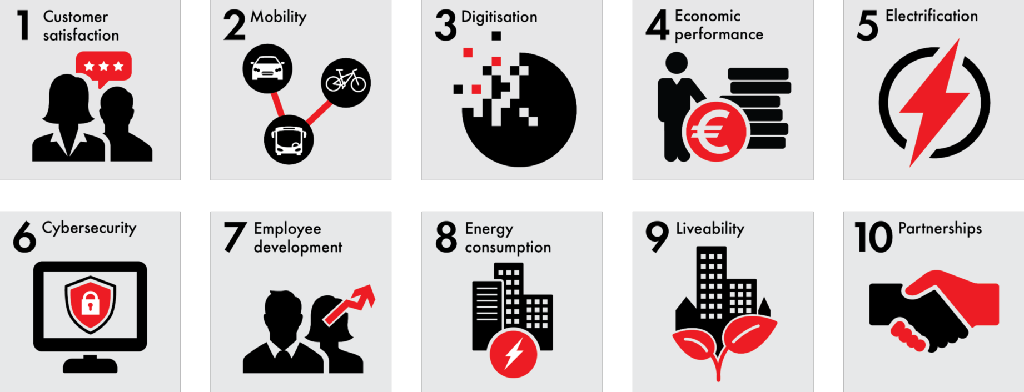
Every three years we conduct a materiality analysis to identify the topics that are most relevant to our stakeholders.
The top ten material topics identified are customer satisfaction, sustainable mobility, digitisation, economic performance, electrification (EV charging and EV fleet), cybersecurity, employee development, energy consumption, urban liveability and strategic partnerships.
Figure 4 Top ten material topics
Key results summary
We report our results over 2021 and where we have data available of previous years, we show comparable results.
Customer satisfaction is measured by monitoring the average score of Google reviews. We maintained our average score at 3.7 (on a five-point scale), generated by 12,631 reviews (2020: 10,867 reviews).
Sustainable mobility services include transforming search traffic to destination traffic and is enhanced with:
parking facilities (PFs) near public transport hubs up from 204 (2020) to 209 (2021);
bicycle parking as a service up from 104 (2020) to 119 (2021).
Digitisation is about expanding our smart back-office systems and business intelligence instruments to improve informed decision making, providing more online information and enabling customers to pre-book at more PFs. We continue to move forward in digitising our business, our partnerships and customers' journeys.
A key aspect to optimising digitisation is unlocking PFs with automatic number plate recognition (ANPR) with our proprietary platform PaSS:
PaSS enabled PFs in 2021 are 204 (2020: 168).
Electrification for us means increasing the number of electric vehicles in our fleet and significantly increasing the number of EV charging points installed in our PFs, we now have:
69 EVs in our fleet (2020: 62), an increase of 11%;
2,114 EV charging points (2020: 1,190), an increase of 77.6%;
227 PFs providing EV charging (2020: 203), an increase of 11.8%.
Chart 1 EV charging points
Our cybersecurity awareness programme was rolled out in 2019 and is still ongoing in 2021, including online training for over 1,340 employees. Our overall employee development is expressed by employees receiving regular general training (2021: 1,394 compared to 2020: 920, an increase of 51.5%).
The total energy consumed in our owned and long-leased parking facilities (O+LL PFs) amounted to 71.1 GWh compared to 70.6 GWh in 2020, a slight increase of 0.75%. This includes energy used by our increasing number of EV charging points.
Chart 2 Total GWh consumed by O+LL PFs
Our carbon footprint per parking space in owned and long-leased parking facilities (O+LL PFs) is slightly higher compared to 2020 too. The average kgCO2 per parking space is 93 (2020: 91), an increase of 1.86%. This increase can be attributed to more EV charging points in our portfolio and fewer coronavirus measures in 2021 than in 2020, reflecting an increase in travel.
Since we started measuring our emissions in 2010, we have already achieved a 51% reduction.